Steering the ship: integrate risks (a sailing story)
For as much time we spend estimating a project, it is just one likely scenario among many others. Agile teams are not shy of this, overthinking story points estimates and velocity. It doesn’t mean estimates should be thrown away, but that it should be completed with risk management at least (or its big brothers, scenario-based planning, real options, etc.).
My most vivid and teaching experience comes from a memorable adventure in my youth, sailing through the Channel islands that taught me real-life risk management metaphors that I ended up applying in my practice. Here’s how we did the pilotage plan and how it turned out.
Project management in agile is based on simplified indicators: in Scrum, a progress diagram compiling team speed and complexity remaining to be done. In Lean Software, a flow diagram integrating cycle time and work in progress. These indicators are decoys if you don’t know how to manage risk.
Have you ever heard the nautical metaphors “the project is drifting”, “we’re on course”? I’m going to take the metaphor at face value, and tell you an anecdote that once happened to me.
Hoist high!
During my student years, I went for a week of sailing with a professional skipper and 2 friends.

Very quickly, we saw that our team was functioning well. We got along without stepping on each other, a fundamental aspect in this closed box which is a 5.50m living area. Each one having his little experience of navigation, the coordination was prowling, we maneuvered faster and faster. One evening, while we were anchored in the harbor of Port-Blanc, the skipper offered us a challenge:
“Tomorrow, moderate wind forecast. Are you keen on the Channel Islands? Departure at night, long day of navigation, we have to plan everything, like real sailors. ”
We said yes.
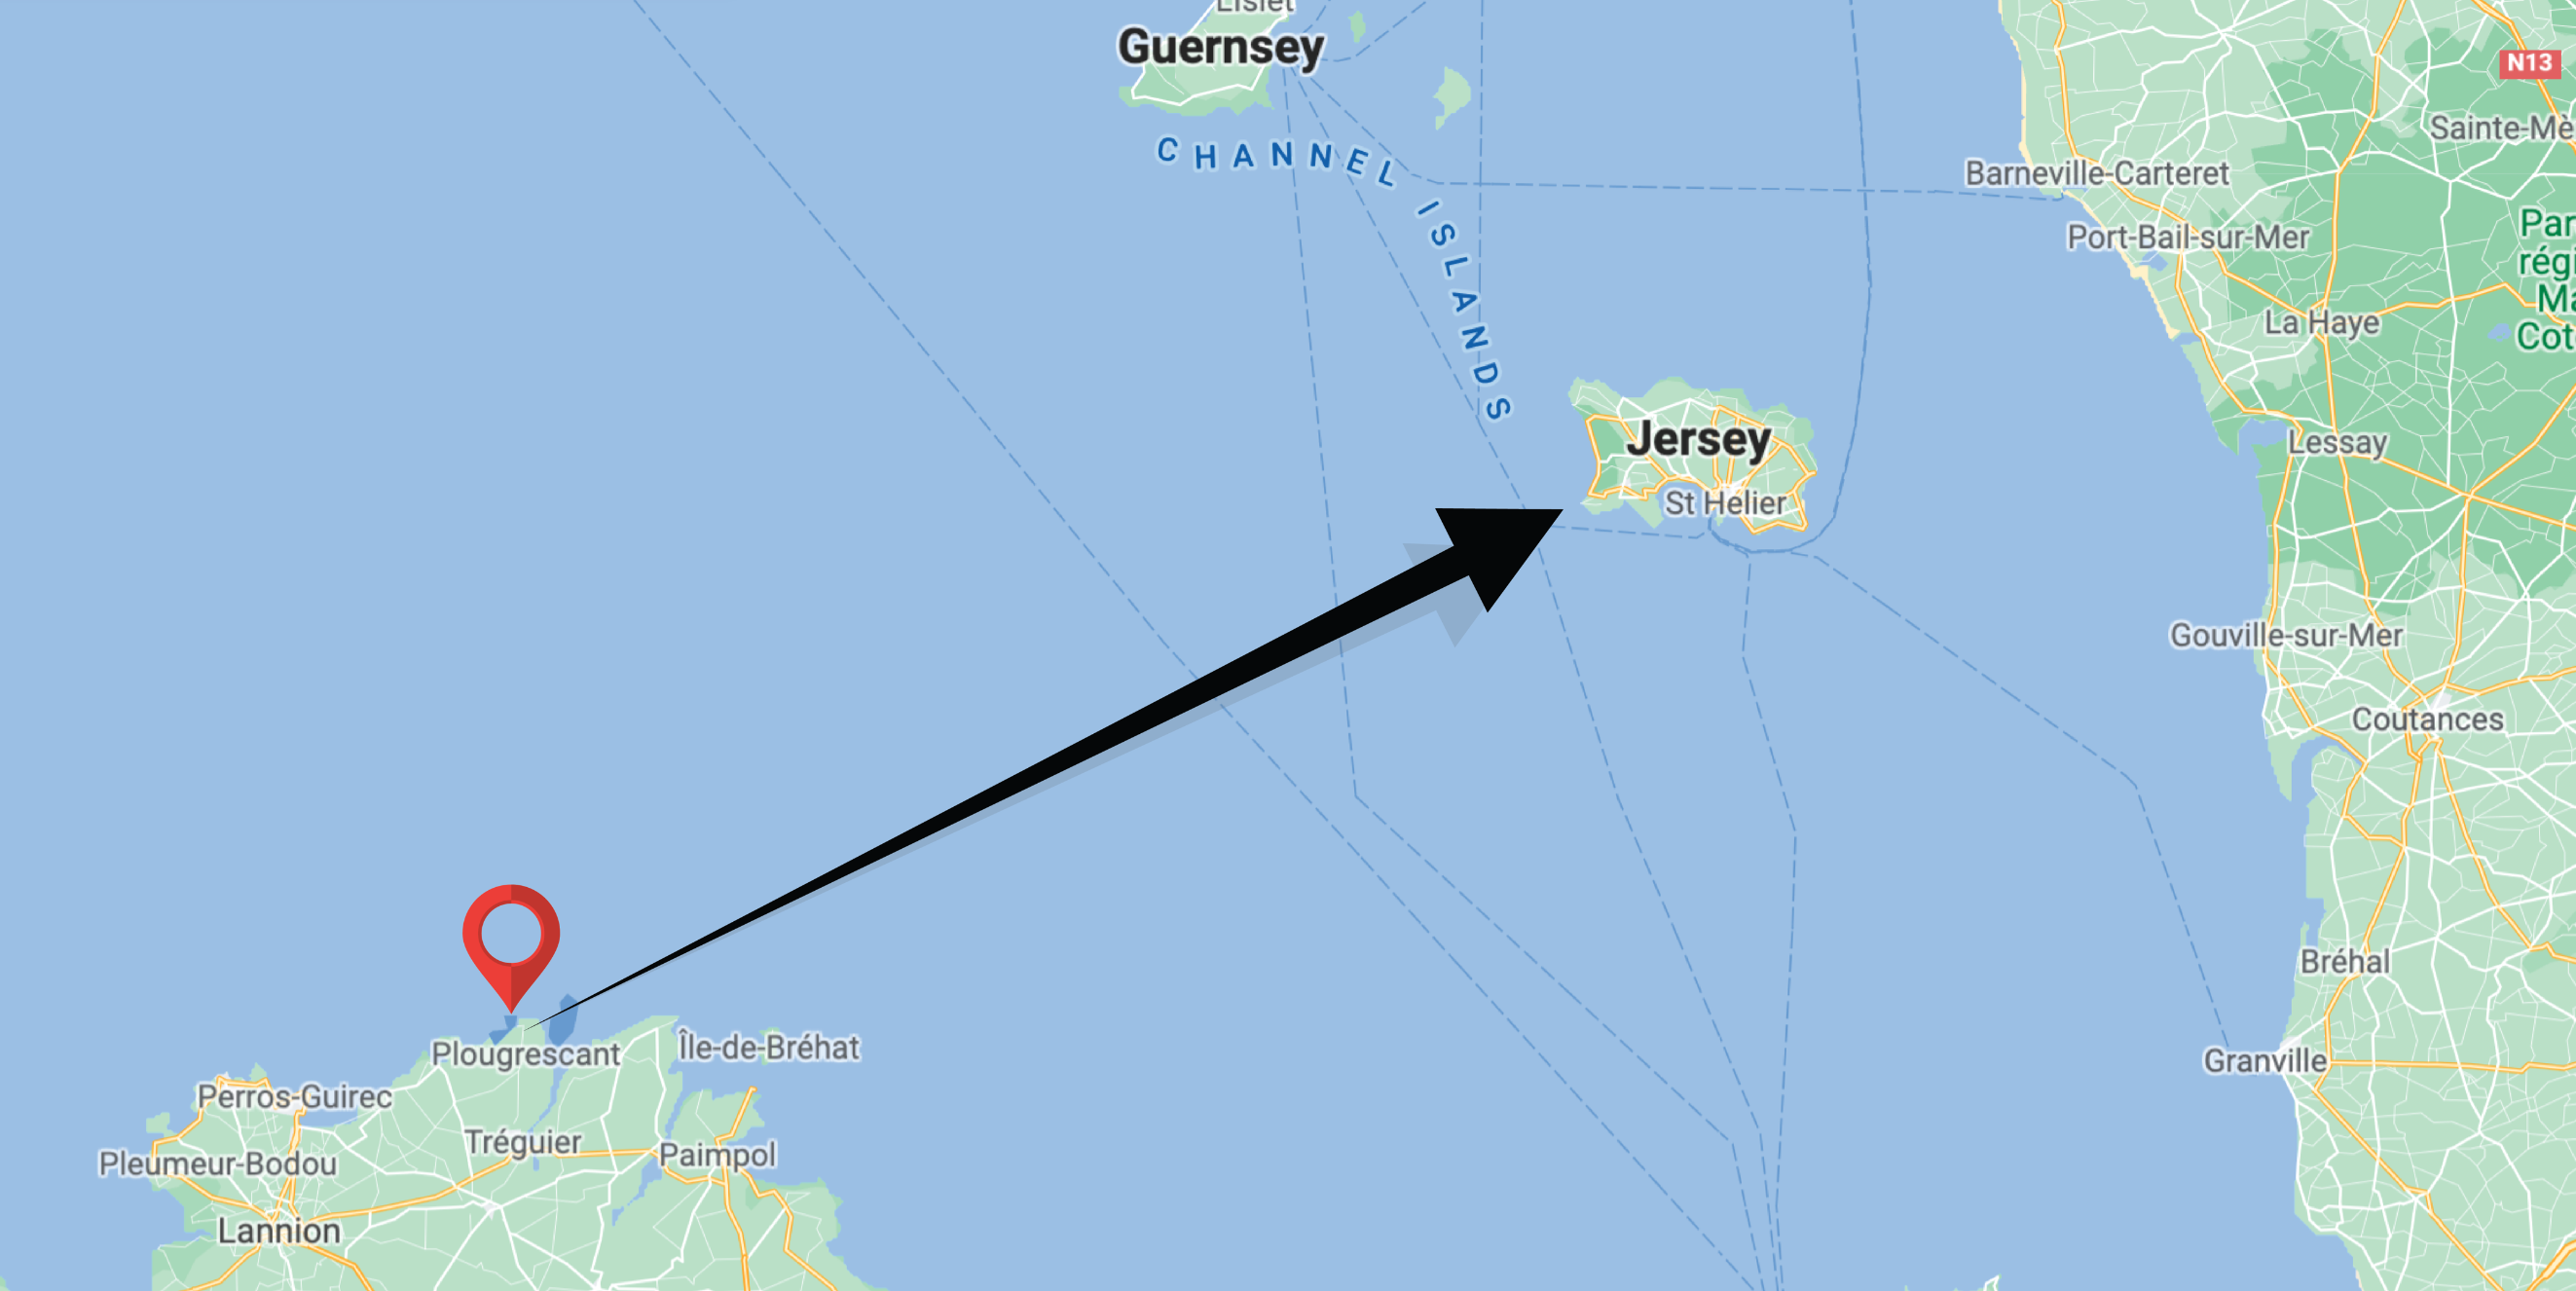
Heading to Jersey

To navigate far from the coast, without visual reference and over such a distance, you only have the compass to orient yourself, so you have to set a course and follow it. This course requires certain calculations.
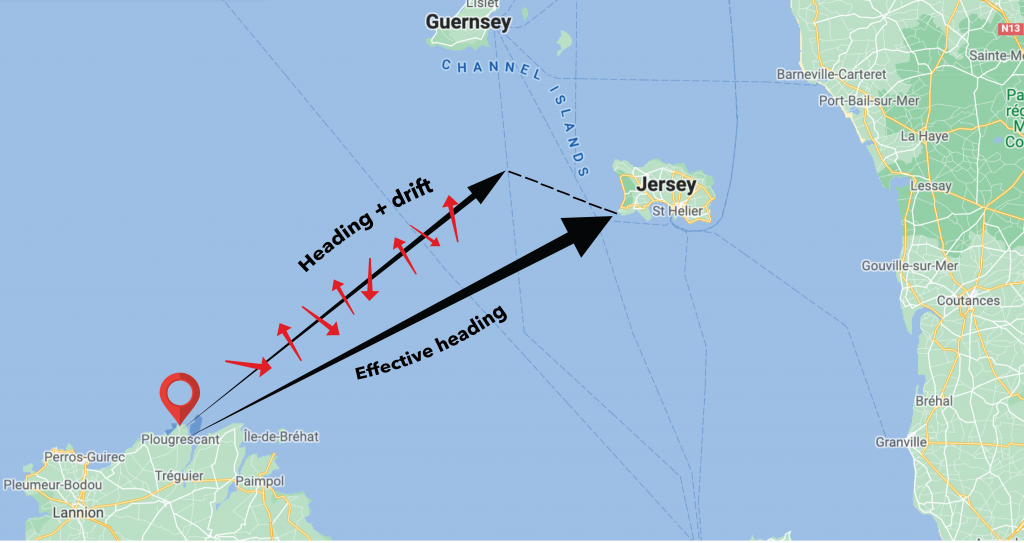
To begin with, we calculate the drift. We take the maps of the marine currents and add up all their vectors, hour by hour, throughout the journey, to arrive at the total drift. Let’s say that according to this vector we would arrive 10 miles to the south of the theoretical destination.
So we take our default course, the straight line between us and Jersey, and we compensate for it, as if the island is actually 10 miles north. The heading (angle to north) is measured to follow this new line.

In our case, precision mattered because after 12 hours of navigation, we would definitely end up tired. Any delays would draw our strength. This would just be the beginning. Depending on the time of day and our position, we would easily suffer currents and winds that we would not have accounted for, making the journey a real pain. While GPS can eliminate the danger of getting lost, the sea is dangerous – especially for an exhausted crew who sleeps in a cramped living space smaller than most bathrooms. So everyone cross-checked the calculations to be certain of the drift vector and the resulting heading angle. With our freshly celebrated math baccalaureate, we were still confident.
The principle then is to pull anchor at the scheduled time, follow the course with a compass, and, deviated by the current, we arrive at the island. On the strength of our pilotage plan, we went to bed for a night departure.
4 am, they wake me up.
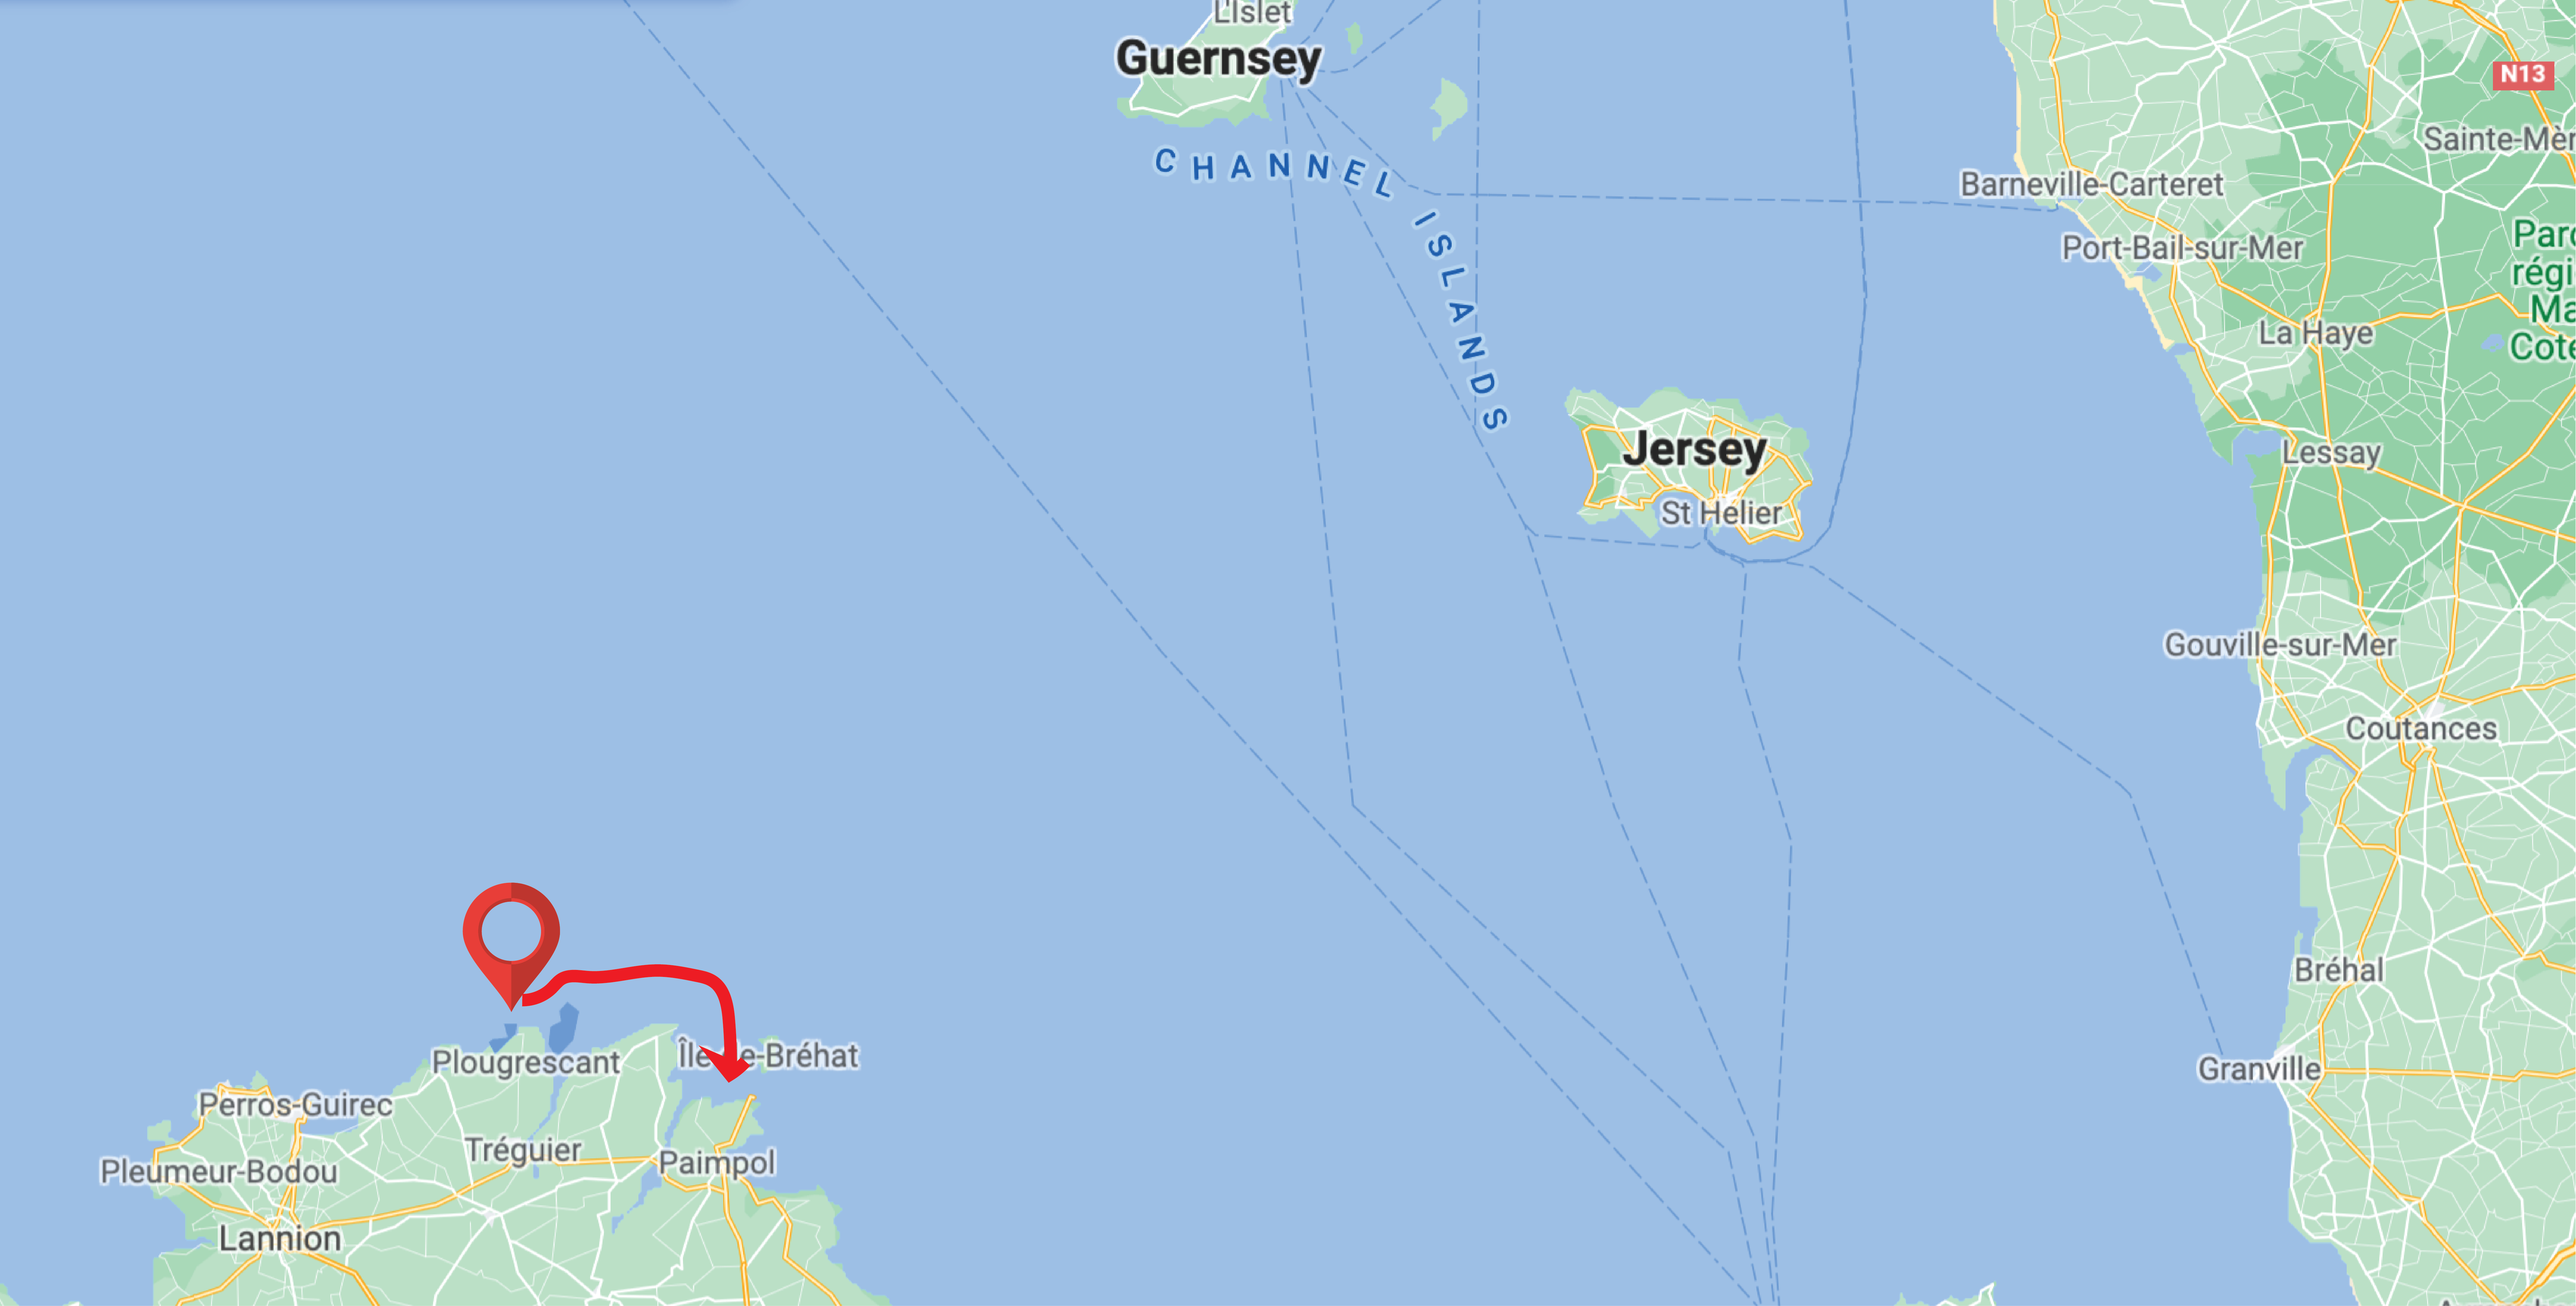
“In fact there is not a fart of wind, we let it go, we will follow the coast to Bréhat.”
Goodbye Jersey.
After a lovely night sailing following the coast line, we docked on Bréhat in the morning under a bright sun. We rested and strolled there before heading out to sea, it was a magnificent day.
From “project that derives” to “damage to the project”
I come back to project management in agile.
Planning requires the assumption of a simplified, linear progression. The deviations tolerated by this hypothesis are simple excesses. But this plan has a pernicious effect: with the time that we invest in our prediction calculations, in summing elements, taking margins,  we tend to take the hypothesis for a reality.
Excluding reality is not linear. An unforeseen event can explode your forecast.
This is what I reproach with velocity curves and progression diagrams: they suggest that the unforeseen will cause linear drifts, compensable heading deviations. I fell into this pitfall, and not just when I started out in agile.
I don’t think I’m the only one.
I mentioned nautical metaphors, “drifting project”, “staying the course”, etc. But we never hear “the wind has fallen”, “damage to the project” or “lifeboat”. The unforeseen, the real ones, those which count, do not make the curve drift. They make it obsolete. Of course, you will realize it, but often it will take time, attached as you were to your Excel formulas, and it will be too late.
When the wind drops, we throw away our current calculations, and we forget about Jersey. It is a disruptive event.
How to integrate a progress indicator into project management that sets the course under normal conditions, while remaining attentive to these disruptive events, in order to let go of the plan and take the necessary decisions in time?
I believe in a schizophrenic piloting using at equal value:
- a progress chart, burnup chart or burn down chart, which predicts “what will we finish when”
- a risk sheet, recapitulating “what would make this diagram no longer make sense”
This risk sheet is a classic project management practice, I am not reinventing the wheel. However, I find it too little mentioned in the agile world, and often forgotten by new teams, so I insist: it must be included and up to date in your management documents. Go further :
it’s not just a piece of information,
it’s an antidote to the belief in linear progression.
Concretely, I draw a principle for roadmaps, progress diagrams, or any form of projection that you use to manage:
we never present a schedule without the risks on the side
On the wall, display the risk sheet next to the roadmap. In your excels, write the risks under the progress chart, not in a separate tab. With just one schizophrenic look, you will have one eye on the indicators, the other on the risks.
Coming soon: build a risk matrix (simplified)
Tags: Agile Management , Control , Drift , Risk matrix , Piloting , Project Management , Risks , Risks , Velocity
Tags: Agile Management, Contrôle, Dérive, Matrice de risques, Pilotage, Project Management, Risks, Risques, Vélocité
Learn the best practices from a professional coach.
I provide agile management and role training to deliver results, from startups to global enterprises.